jeudi 23 janvier 2014

about Lanxess ...


LANXESS AG NPV (LXS)

45,07 EUR 
-2,02% | -0,93 
 23/01/2014 13:46


  • Lanxess

  • Lanxess est un groupe chimique allemand qui propose toute une gamme de composés chimiques, par exemple dans les domaines des plastiques hautes performances et des caoutchoucs. Il fait partie du DAX. Wikipédia


  • Cours de l'action : LXS (XETRA)45,08 €-0,92 (-1,99 %)
    23 janv. 13:42 UTC+1 - Clause de non-responsabilité

  • Date de fondation : 28 janvier 2005


  • LE GROUPE LANXESS


    LANXESS est un groupe de chimie de spécialités leader qui a généré en 2012 un chiffre d'affaires de 9,1 milliards d'euros avec un effectif d'environ 17 400 salariés répartis dans 31 pays. Avec 48 sites de production, le groupe est présent dans le monde entier. Les activités clés sont le développement, la production et la vente de matières plastiques, de caoutchoucs, de produits chimiques intermédiaires et de spécialités. LANXESS est coté dans les principaux indices de développement durable, le Dow Jones Sustainability Index (DJSI) World, le FTSE4Good , ainsi que le Carbon Disclosure Leadership Index (CDLI).


  • Lanxess attend un rebond de ses résultats en 2014

    - Reuters 0 Commentaire(s)
    FRANCFORT, 22 décembre (Reuters) - Lanxess, le premier fabricant mondial de caoutchouc synthétique pour pneumatiques, s'attend à un rebond de ses résultats en 2014, soutenus par son plan de réduction de coûts, a annoncé Axel Heitmann, président du directoire du groupe.
    "Comme nous avons beaucoup d'idées et de projets, je reste confiant pour l'an prochain", a-t-il dit dans une interview au journal Frankfurter Allgemeine Sonntagszeitung. "Même si les prix restent faibles, nous allons améliorer nos résultats."
    Le groupe a annoncé en novembre une fourchette de prévision pour son résultat brut d'exploitation (Ebitda) pour l'année 2013 située entre 710 et 760 millions d'euros, contre 1,23 milliard en 2012.
    Axel Heitmann a ajouté dans son interview paru dimanche que la baisse attendue pour cette année s'inscrivait dans un contexte de marché faible dans le secteur de la chimie.
    "Ce n'est pas mal étant donnée la situation actuelle. Le flux de mauvaises nouvelles ne montre pas de signe d'accalmie." (Ludwig Burger, Juliette Rouillon pour le service français)


  • jeudi 9 janvier 2014

    Back to CAC 40 ...


    STMICROELECTRONICS (STM)

    5,48 EUR Temps réel 
    -2,04% | -0,11 
     09/01/2014 10:46


    STMICROELECTRONICS a fourni plusieurs composants clés pour la nouvelle Kinect de MICROSOFT


    08/01/2014 à 17:17 / Mis à jour le 08/01/2014 à 17:17

    (AOF) -  STMicroelectronics5.49 | -1.84% | 09/01/2014 - 10h25Cours - Actualités | Consensus | Société
    Conseil Premium
    Ajouter à la liste des valeursAjouter au portefeuilleCréer une alerte
    STMicroelectronics (STM 5.49 -1.84%) a annoncé avoir fourni à Microsoft plusieurs composants clés pour le nouveau capteur Kinect de sa dernière console Xbox One, aux termes d'une étroite collaboration. « Les importantes qualifications obtenues auprès de Microsoft soulignent la richesse de notre technologie, ainsi que notre capacité à fournir des solutions de pointe », a déclaré Bob Krysiak, vice-président exécutif et Président de la région Amériques du fabricant de semi-conducteurs. Ce dernier a rappelé que plus de trois millions de Xbox One ont été vendus depuis son lancement le 22 novembre.

    AOF - EN SAVOIR PLUS

    Les points forts de la valeur

    - Cinquième mondial et premier européen des semi-conducteurs destinés aux télécoms, aux produits de consommation électronique, à la robotisation ;
    - Leader mondial dans les microsystèmes électromécaniques (Mems) et dans les capteurs de mouvement pour tablettes et mobiles, un marché qu'il contrôle à 48 %, loin devant ses concurrents ;
    - L'une des entreprises les plus innovantes de son secteur, notamment dans les microcontrôleurs et l'électronique de puissance ;
    - Croissance portée par la demande chinoise et le développement des écrans tactiles et autres « netbooks » ;
    - Démantèlement de la co-entreprise ST-Ericsson dédiée à la téléphonie mobile, ce qui permettra, d'ici la fin 2013, la disparition d'un foyer de pertes après un débours de l'ordre de 300 à 350 MEUR ;
    - Déception à l'été en raison de pertes semestrielles supérieures aux anticipations ;
    - Situation financière saine.

    Les points faibles de la valeur


    - Pression concurrentielle forte dans les circuits intégrés pour mobiles ;
    - Déséquilibre entre la division SPA (Automotive products), bénéficiaire et la division EPS (solutions embarquées) dont les pertes opérationnelles pèsent sur la rentabilité du groupe ;
    - Ralentissement de la demande, notamment dans les smartphones et les puces pour décodeurs numériques ;
    - Méfiance des investisseurs à l'égard des objectifs 2014 de hausse de 20 % des ventes et de la marge brute ;
    - Avertissement sur résultat 2013 lancé fin octobre ;
    - Rentabilité inférieure à celle des autres poids lourds du secteur en raison d'une structure de coûts fixes élevés, notamment en Europe.

    Comment suivre la valeur

    - Secteur très cyclique et fortement dépendant des secteurs automobile, informatique, industriel et grand public ;
    - Volatilité boursière en fonction des niveaux de stocks mondiaux de semi-conducteurs, des commentaires de Texas Instruments et des parités de change euro-dollar ;
    - Retombées de la réorganisation du groupe en deux divisions, SPA (Sense Power and Automotive, produits de détection et de puissance et composants pour l'automobile) et EPS (Embedded Processing Solutions ou solutions de traitement embarquées) qui vise à abaisser les charges d'exploitation dans les usines dès 2014 ;
    - Evolution du conflit entre ST-Ericsson et Samsung, qui pourrait déboucher sur un accord amiable ;
    - Retombées commerciales, à partir de 2014, des premiers produits FD-SOI de renforcement de puissance des circuits électriques, fabriqués en partenariat avec le Cea et Soïtec ;
    - Lancement, avec l'Etat français, d'une co-entreprise de production, à Cralles en France, de microprocesseurs destinés aux routeurs et smorphones, dans laquelle le groupe investira 1,3 MdEUR d'ici 2017 ;
    - Valeur non opéable, contrôlée à 27,5 % par ST Holding, société détenue à parité par les états italien et français.

    LE SECTEUR DE LA VALEUR

    Electronique

    Selon l'institut GfK, le marché français de l'électronique grand-public (électronique, informatique, photo et télécommunications) s'est replié de 6% à 15,8 milliards d'euros l'an passé. Les volumes se sont significativement contractés, en particulier pour les téléviseurs. Ce segment de marché, qui avait été porté par l'essor des écrans plats et la fin de l'analogique, a plongé de 23%, à 6,7 millions d'unités. Ce niveau est bien loin du pic atteint en 2010 (à 8,8 millions d'exemplaires). Cette baisse a été généralisée à toute l'Europe (à l'exception de l'Allemagne où les ventes de téléviseurs ont été stables l'an dernier). La taille moyenne d'un téléviseur a bondi de 60 cm il y a dix ans à 84 cm en 2012 (+5 cm par rapport à 2011). GfK souligne que l'offre se complexifie et que l'adoption des nouvelles technologies (telles que la télévision connectée ou les écrans Oled) se fait un peu plus lentement. Le recul du marché français de l'électronique grand-public devrait être limité à 1,6% cette année.

    DERNIERE RECOMMANDATION SUR LA VALEUR

    Barclays a abaissé sa recommandation de Pondération en ligne à Sous-pondérer et son objectif de cours de 5,50 euros à 5 euros sur STMicroelectronics. Etant donné des difficultés dans certains marchés finaux et la vigueur de l'euro, le bureau d'études s'attend à ce que les prévisions 2014 du fabricant de semi-conducteurs déçoivent et à ce que les estimations des analystes soient réduites. Ce qui aurait pour conséquence de rendre l'action chère. Elle affiche actuellement un PER 2015 de 19, selon Barclays.

    CONSENSUS DES PROFESSIONNELS


    D'après le consensus de marché calculé à la date du 01/01/2014, les analystes conseillent de rester neutre sur le titre STMICROELECTRONICS. En effet, sur un total de 4 bureaux d'études ayant fourni des estimations, 2 sont à la vente et 2 sont neutres. L'indice de recommandation AOF, reflétant l'avis moyen des analystes et s'étendant de -100% à +100%, est de -50%. Enfin, l'objectif de cours moyen est de 6,2 EUR. Le consensus précédent conseillait de conserver la valeur .


    mardi 7 janvier 2014

    About Silver & Fresnillo @ Seeking Alpha


    Visit Fresnillo plc investor relations site

    FRESNILLO (FRES)

    728,50 GBp @ LSE
    -0,95% | -7,00 
     07/01/2014 11:46


    Understanding Silver Mining Costs: Analyzing Fresnillo - The Silver King


    Jun. 18, 2013 7:47 AM ET

    Introduction
    In our earlier article about Q1FY13 silver industry costs, we discussed how much it costs to mine an ounce of silver. This metric can help an investor figure out whether it is time to buy SLV and/or the silver miners. In that analysis, we used the Q1FY13 financials to calculate the combined results of publicly traded silver companies and come up with a true all-in industry average cost of production to mine each ounce of silver.
    In this analysis we will calculate the real costs of production of Fresnillo PLC (OTCPK:FNLPF). Fresnillo is the largest primary silver miner in the world (producing about 7% of total annual silver mine supply) and operates the Fresnillo mine in Mexico, which is the largest silver mine in the world. Our goal in this analysis is not to analyze Fresnillo, but it is to calculate their true all-in costs to understand how much it costs to mine each ounce of silver. This will help investors of the silver ETFs (SLVCEF, and PSLV) understand the true production costs of their asset and show where unsustainable levels of production may lie.
    Calculating the True Mining Cost of Silver - Our Methodology
    In the previously mentioned article, we gave a thorough overview of the current way mining companies report their costs of production and why it is inaccurate and significantly underestimates total costs. Then we presented a more accurate methodology for investors to use to calculate the true costs of mining gold or silver. Please refer to that article for the details explaining this methodology, which is an important concept for all precious metals investors to understand.
    Explanation of Our Metrics
    Cost Per Silver-Equivalent Ounce - is the costs incurred for every payable silver-equivalent ounce. It is Revenues minus Net Income, which will give an investor total costs. We use payable silver and not produced silver, because payable silver is the silver that the miner actually keeps and is more reflective of their production. Miners also use payable silver and not produced silver when calculating their cash costs, so this is pretty standard.
    We then add Derivative Gains (or minus Derivative Losses), which will give investors total costs without the effects of derivatives. Finally, we add Foreign Exchange Gains (or minus Foreign Exchange Losses) to remove the effects of foreign exchange on the company's costs.
    Cost Per Silver-Equivalent Ounce Excluding Write-downs - is the above-mentioned "Cost per silver-equivalent ounce" minus Property/Investment Write-downs and Asset Sales. This provides investors with a metric that removes exceptional gains or losses due to write-downs and asset sales.
    Cost Per Silver-Equivalent Ounce Excluding Write-downs and Adding Smelting and Refining Costs - is the above-mentioned "Cost per silver-equivalent ounce excluding write-downs" adding in smelting, refining and all other necessary pre-revenue costs. This is a new metric that we are now introducing to our true all-in cost series because it will more accurately measure all-in costs and allow comparisons between miners.
    Most investors are unaware that many miners will remove smelting, refining, and other costs before reporting their total revenues figures and these pre-revenue costs are not reported in the income statement. The result of this is that it skews all-in costs higher for miners that refine themselves or include the costs in their income statement, while inaccurately showing lower costs for miners that remove it before reporting revenues.
    A simple test can be done on any miner to see if there are any pre-revenue costs that are not reported in the income statement. Simply take payable production and multiply it by average realized sales price and this should come relatively close to the total revenues figure. If it gives you a number much higher than reported revenues then there are pre-revenue costs that are not being reported.
    This line should alleviate these issues and allow comparisons on a fair basis.
    Real Costs of Production for Fresnillo - FY2012
    Let us now use this methodology to take a look at Fresnillo's results and come up with their average cost figures. When applying the methodology for the most recent quarter and FY2012, we standardized the equivalent ounce conversion to use the average LBMA price for Q4FY12. This gives us a gold ratio of 53:1, zinc ratio of 37:1, and a lead ratio of 33:1. We like to be precise, but minor changes in these ratios have little impact on the total average price - investors can use whatever ratios they feel most appropriately represent the by-product conversion.
    As we stated earlier, the reason to analyze Fresnillo is because they are the largest silver miner in the world and that will give us a very nice benchmark for the true all-in cost to mine silver. From the previous article, we know that many silver miners are producing silver with all-in costs around the low to mid twenties.

    (Click to enlarge)
    Notes about True All-in Costs Table
    Fresnillo does not have financial results reported for Q1FY13 (they report on a different schedule than most U.S. companies), so we do not have their all-in costs for the quarter, but we have included their silver production statistics because it is relevant to this discussion.
    Observations for Silver Investors
    Based on 2012 numbers, it looks like Fresnillo produces silver with true all-in costs of around $20.88, which is up about 4% from their 2011 numbers. This ranks it as a very low cost producer compared to many other silver miners, but at current silver prices their margin is almost nothing.
    What is really interesting is that this 4% rise in costs occurred even though taxes dropped by more than $175 million, or around $2.50 per silver ounce. So the drop in taxes actually masked a much greater rise in all-in costs for Fresnillo.
    Rising costs at the very largest silver producer show that it is the whole industry that is finding it more expensive to mine silver. That means that it is not a handful of companies or particular geographic locations that are getting expensive - silver is getting more expensive to mine no matter who is mining it.
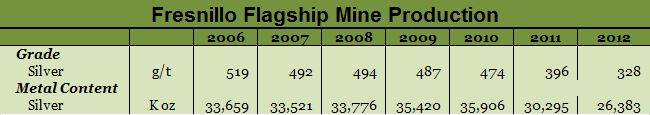
    Production Numbers - As we take a look at Fresnillo's production numbers we find that even though costs are rising it doesn't seem that Fresnillo is producing more silver. In fact their silver production dropped by 900,000 ounces from FY2011 to FY2012. Based on projected first quarter numbers of 10.05 million ounces of silver, it looks like FY2013 may be even less than FY2012.

    (Click to enlarge)
    As investors can see based on their flagship Fresnillo mine (the largest primary silver mine in the world), grades have been dropping fast over the last six years and the company expects them to drop further. This is endemic of the entire industry's problem - costs are rising as ore grades drop. It is not management inefficiencies that is causing costs in the mining industry to rise, but it is clearly because it is getting harder to find quality deposits. That means that rising costs are a structural problem and not a cyclical one.
    What is scary for silver miners (and bullish for silver investors) is that the large silver mines are being exhausted and are not being replaced by similarly large mines. This means that unless there is some major industry change (much like what shale did for the oil industry), future silver production will start to drop as production mines are exhausted and new supply will not fulfill the lost production - and this drop may be quite precipitous.
    Conclusions for Investors
    The largest silver miner in the world is experiencing the same problems as the rest of the silver industry. Costs have been consistently rising even as lower grade ores cause production to drop. Margins also have been significantly hurt, and even low-cost Fresnillo is seeing margins of less than $1 per ounce at current prices and costs continue to rise.
    We believe this situation is unsustainable at current silver prices and since much of the cost rises are structural and not cyclical, management at many silver miners will not be able to do much to cut costs. Of course they will cut development costs and overhead, but as ore grades continue to drop this will not be enough to drive down all-in costs and will end up exacerbating the problem by cutting future production of silver.
    Silver investors should be patient and realize what we are witnessing is the paper markets dropping the silver price to a level that is lower than miners can extract the metal. This is creating a situation where the longer the silver price stays at or below current levels, the more long-term damage will be done to the industry and the less future supply of silver will be available.
    Even though the silver price may drop further in the short term, investors should be comfortable taking a longer time horizon. Accumulate physical silver and the silver ETFs (SLV, PSLV, and CEF) and if investors can be patient enough to hold them for a few years, they should see significant returns as the industry cuts back current and future supply. We do not think that silver production is sustainable anywhere close to current production levels with a silver price under $20 per ounce - short-term traders may take the price below that, but that would make most silver mining unprofitable.
    Be patient silver investors because the structural limits of the geology and industry will boost silver regardless of what the Federal Reserve does.


    Alcoa @ Seeking Alpha


    ALCOA (AA)

    13,08 USD 
    -0,98% | -0,13
     10/04/2015 19:15


    Alcoa (AA), le groupe d’aluminium, a dévoilé pour son premier trimestre 2015 un chiffre d’affaires de 5.8 milliards de dollars en hausse de 7% sur un an grâce principalement à ses activités dans l’automobile et l’aéronautique. Le résultat net est ressorti à 195 millions de dollars (0.14 dollar par action) contre une perte de 178 millions de dollars (0.16 dollar par action) au premier trimestre 2014. Le groupe table sur une hausse de 6.5% de la demande globale d’aluminium en 2015 à 57.5 millions de tonnes, un record. Pour 2014, Alcoa estime que la croissance de la demande a atteint 9% contre une précédente anticipation de 7%.


    10,53 USD 
    -0,38% | -0,04 
     06/01/2014 22:01


    3 Reasons Why Alcoa Is A Buy


    Dec. 30, 2013 4:26 PM ET

    The plunge in the prices of aluminum made 2013 a year to forget for miners like Alcoa (AA). Wide-scale aluminum users have long complained about the rising costs incurred as a result of delayed metal deliveries. As a result, the London Metal Exchange imposed a new set of rules through which the warehouses with the longest delivery time will see that time cut down to half, enabling them to deliver more aluminum than they can consume. This ultimately put more pressure on aluminum prices, which are already near a four-year low.
    The reduction in prices has put downward pressure on Alcoa's share price; however, it has gained momentum since its latest earnings report. The key points of the report were:
    · Net income jumped 116.8% year-over-year, rising from a loss of $143 million to a profit of $24 million.
    · Cost of goods sold was 83.2% of total revenue, an improvement from 90.3% in the corresponding quarter of the previous year.
    · Despite lower aluminum prices, the aluminum giant managed to post EPS of $0.11, which was above the industry average.
    Getting a boost
    Moreover, Goldman Sachs recently upgraded Alcoa's rating from neutral to buy. In addition, analyst Sal Tharani revised his price target upwards to $11. Tharani noted, "We estimate Alcoa will add more than $2bn of revenue and more than $525mn of additional EBITDA to its mid- and down-stream businesses over the next three years from end-market growth and share gains. Alcoa's downstream businesses, particularly Engineered Products, are less aluminum price sensitive and we see upside in Alcoa despite our lackluster outlook for aluminum supply-demand fundamentals. In addition, we see further upside beyond our current estimates from the automotive market through growth in "body-in-white" body sheet, as well as from aluminum-lithium in aero. Also, we expect continued productivity improvements and estimate positive free cash flow starting next year."
    This report has further added to the stock's momentum. However, should you consider buying Alcoa at the current price? Let's take a look.
    Solid productivity gains
    The terrific quarterly performance was a direct outcome of the miner's productivity gain. According to Alcoa, it has already generated $825 million of savings on productivity improvements. This has helped the company to perform better than the industry average; however, does that mean that the aluminum giant's business is back on track? Maybe not. Alcoa's growth is noteworthy, but it does not solve the problem at hand -- low aluminum prices. Increasing productivity is only a short-term solution and you can't go on increasing it forever. The law of numbers will catch up and increasing productivity will become more and more difficult with the expansion of business.
    Furthermore, aluminum prices are projected to remain well below the long-term price assumption of $2,250 a ton in each of 2013 and 2014, primarily because of the market's high inventory levels and production overcapacity.
    What may drive growth?
    To fortify its position and drive long-term growth, Alcoa is switching its attention to niche specialty markets that should provide higher margins. Alcoa anticipates aerospace segment sales to grow 9%-10% in 2013, fueled by the enlarged backlogs of Boeing and Airbus. In fact, the miner has already signed a deal worth roughly $110 million to supply titanium and aluminum parts to Airbus.
    (click to enlarge)
    The company also expects the automotive industry to become more aluminum-centric, which would lead to a more than three-fold growth in revenue from this segment.
    Growth across its niche markets, combined with cost controls, are the primary reasons why Alcoa's management is confident that it's on track to meet its yearly goal, which is to be cash-flow positive. Considering the fact that Alcoa's value-add business now accounts for nearly 57% of its revenue, it may be able to achieve its goal.
    Conclusion
    Alcoa is looking to add to its revenue going forward and is also focused on reducing costs. As the one of the largest producers of aluminum, Alcoa is well-positioned to benefit from the increasing usage of aluminum in different applications in aerospace and automotives. Thus, it won't come as a surprise if Alcoa maintains the momentum that it has gathered in the last three months into the New Year as well.